Published on: January 17, 2023 at 3:33 PM

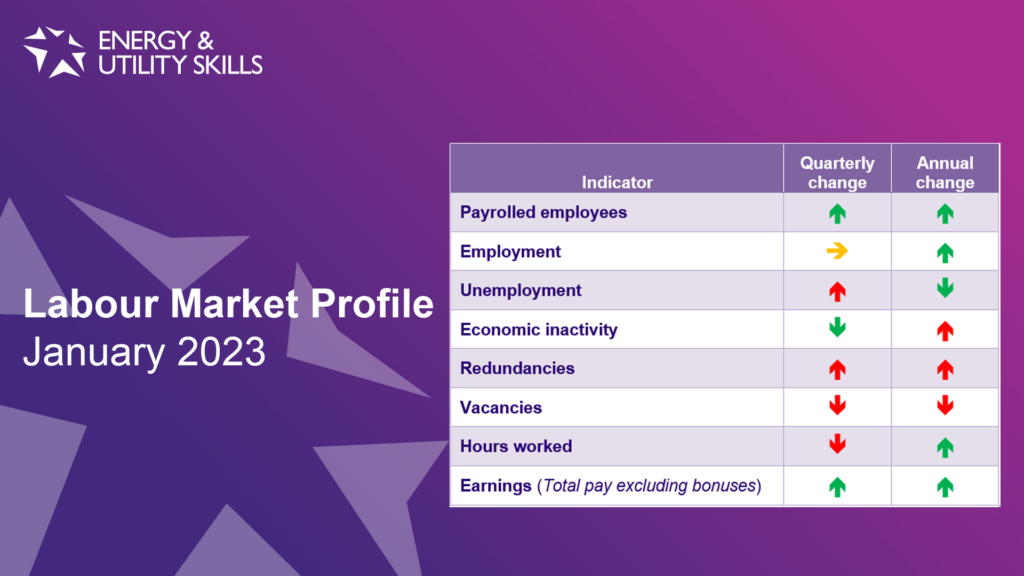
The most recent data shows that the labour market’s post-COVID recovery continues to slow, with 4 out of the 8 main indicators getting worse compared to the previous quarter (and 3 out of 8 worse than a year ago).
- The number of payrolled employees increased by 0.1% over the past month to 29.9 million (up 2.3% over the year)
- The employment rate remained unchanged over the quarter at 75.6% (up 0.2% over the year)
- The unemployment rate increased by 0.2% over the quarter to 3.7% (down 0.4% over the year)
- The economic inactivity rate fell by 0.1% over the quarter to 21.5% (up 0.2% over the year)
- There were 97,000 redundancies during the quarter – 30,000 more than the previous quarter (19,000 more than a year ago)
- The number of vacancies fell by 6.1% over the quarter to 1,161,000 (down 6.8% over the year)
- In the Electricity & Gas industries, the number of vacancies fell by 3.6% over the quarter (down 7% over the year) to around 5,000
- In the Water supply, sewerage, waste & remediation activities industries, the number of vacancies fell by 10.3% during the quarter (down by 17.6% over the year) to around 7,000
- Total hours worked fell by 10 million hours over the quarter to 1.036 billion hours (up 11.6 million hours over the year)
- Earnings growth in average total pay (including bonuses) was up 6.4% and regular pay (excluding bonuses) was also up 6.4%
- In real terms (adjusted for inflation), growth in total pay and regular pay was down 2.6% (this is slightly smaller than the record fall in real regular pay we saw in June 2022 (down 3%), but still remains among the largest falls in growth since comparable records began in 2001)
The Office for National Statistics’ full update on the state of the labour market in January 2023 can be found here.
The next update will be on 14 February 2023.
For further information about the labour market, migration or regional labour market indications, please email Rob Murphy, our in-house strategic workforce planning consultant.
![LMI Graphic [Converted] Labour Market Profile Data Statistics Graphic](https://www.euskills.co.uk/wp-content/uploads/2022/06/LMI-Graphic-Converted-800x500.jpg)